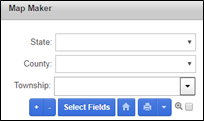
Map Maker
Map Maker
Map Maker is used to access a field’s multiple layers of data: zone maps, EC, elevation, GNDVI image, SSURGO Soil Survey maps, and yield maps. Each layer can be viewed and printed.
In this chapter you will learn how to:
View Existing Fields on a Map
View a Field’s Data Layers
Print Data Layers
View Existing Fields on a Map
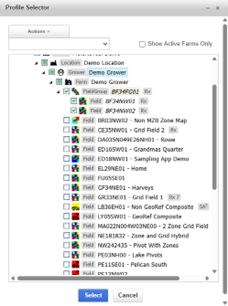
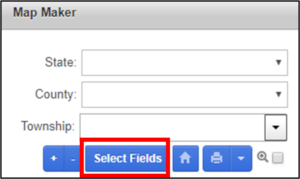
Click Select Fields to open the Profile Selector.
Navigate to the desired Grower and Farm, and check the box next to any desired field or fields to load them to the map pane. You may also check entire Growers or Farms if desired.
Click Select, at the bottom of the Profile Selector.
The selected field(s) will load to the map pane. Displayed on the left side of the form are the total acres within the field border(s) and a Zones Legend for Zone fields.
When multiple fields have been selected you can use the Zoom Box to zoom to an individual field or a smaller area in a field.
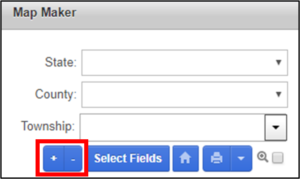
There is also the option to select different background images by clicking the + button on the right hand side and choosing between the options displayed below.
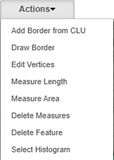
Measure Tools
Measure Length: In the Actions drop down select Measure Length. Left click to start a measure, right click to stop a measure. You can left click multiple times to measure multiple segments, length will appear on the line as you move the mouse.
Measure Area: In the Actions drop down Select Measure Area, left click to start and continue to left click around the desired area. Once you have drawn around the desired area right click to finish and the total area will show up in the middle of the object.
Delete Measures: To clear the map select the Delete Measures in the Action dropdown and all of the measures will be cleared off the map.
Multiple map panes can be opened.
Click the + button above the legend.
Use the profile selector to select another field(s).
Notice the map pane is bordered with a thick red line. This indicates that this pane is active. Toggle between active map panes by clicking on them. If the field is not fully loaded in a map pane, do not switch until loaded. The legend on the left side of the form will only display information for the active map pane.
Click the – button to remove an active map pane.
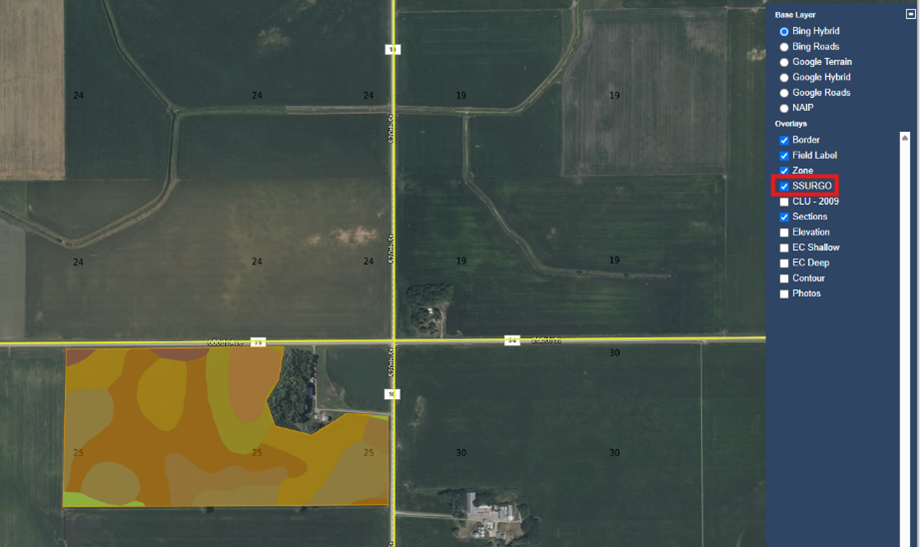
View a Field’s Data Layers
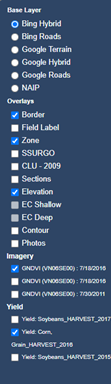
After a field has been loaded to the map pane using the steps above, click on the + button on the right side of the map pane to open the Layer Selector.
Multiple layers of data can be viewed: EC, elevation, GNDVI image, SSURGO, CLU, sections, and yield maps. Click on a layer to toggle it on or off.
Photos taken with the FieldReveal Mobile App can viewed by toggling the Photo layer. Icons appear on the map pane. Click an icon to view the photo.
Hover your mouse over the map to view the raster information, at the pointer location, in the top-right corner of the window.
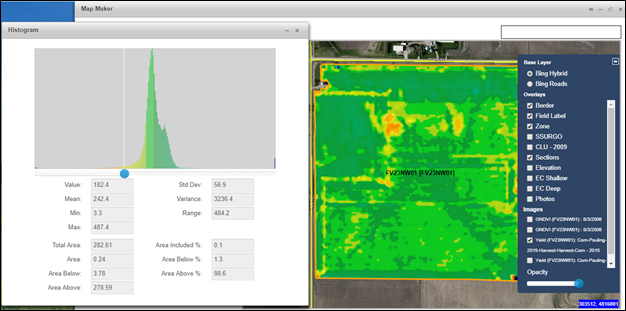
A histogram of the data can be viewed for the following layers: elevation, EC, GNDVI image, and yield maps. This is commonly used on yield maps.
Select a layer.
Click Actions > Select Histogram.
Click anywhere on the map, inside of the field border, to open the Histogram window.
In the Histogram window, move the slider to view areas of the field represented by the value at the slider location. The window also displays information about the data layer including minimum value, maximum value, etc.Print Data Layers
Print Data Layers
Each layer of data can be printed.
Load a field to the map pane using the steps above in, View Existing Fields on a Map.
Using the Layer Selector, select each layer that will be printed.
Click on the down arrow next to the printer icon, and click on a layer to print it individually. Click on the printer icon to print every layer. Click Yield By Zone to print a yield report. A Yield layer must be selected to see the Yield Report options in the dropdown.
NOTE: The size of the printed map layer will be based on the zoom scale on the current map pane in Map Maker.
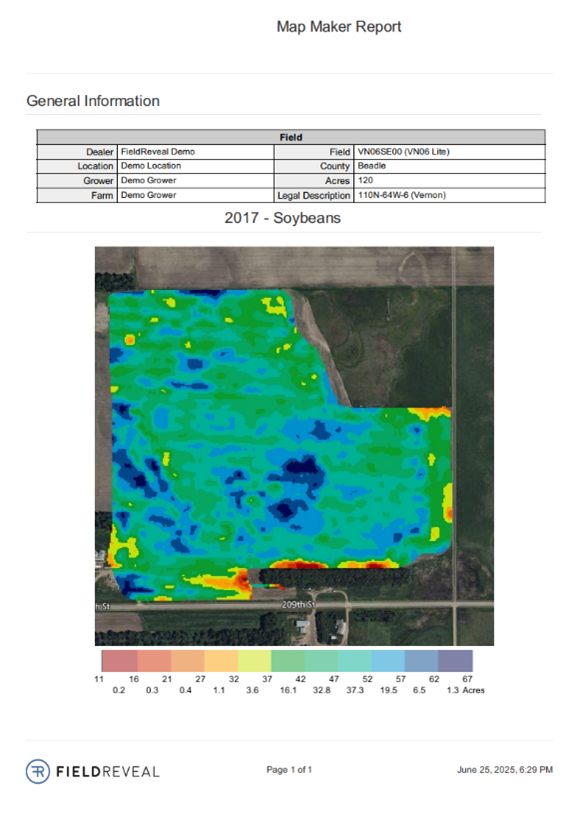
Map Maker Report Examples
Yield Map
Yield By Zone Report
Draw a Map
Map Maker can also be used to draw a border to be used to see the SSURGO Soil Layer.
Select Actions > Draw Border.
Left-click around the field that would like to be viewed. Right-click to finish the border.
Once the border is finished, use the layer selector to turn the SSURGO layer on. This is the only viewable layer available when using the Draw Border function.